
Wicked Problems | Culture & Heritage
2023


Project Overview
A UX design of an app for a wicked problem focused on Culture & Heritage, encouraging people to visit museums and cultural places, and making it easier to users find information and buy tickets.
Roles
UX Designer

4-person collaborative project

Figma | Google Forms
This project aimed to try to solve a wicked problem about Culture & Heritage at UX level.
“Wicked problems are problems with many interdependent factors making them seem impossible to solve. Because the factors are often incomplete, in flux, and difficult to define, solving wicked problems requires a deep understanding of the stakeholders involved, and an innovative approach provided by design thinking.” — Interaction Design Foundation
The problem
Since the 1970s, museums and other public institutions have been suffering a profound crisis. The purpose of this type of institution is to make heritage accessible to everyone. They build bridges between art and people.
How Might We help museums and other public institutions fulfilling their mission of preserving cultural heritage while making it more accessible to a wider audience?
Agenda
Research
Secondary Research
Surveys
User Interviews
Affinity Diagram & Empathy Map
User Persona
User Journey Map
Problem Statement
Ideate
Concept Sketch & Crazy 8’s
Low-Fidelity prototype
Next steps & Conclusions
Research
To try to find a solution to the problem, first, we needed to know what was going on, and what problems were held around culture and heritage, by conducting some secondary research.
Secondary Research
After reading some articles about the topic, we found out that over the years museums and cultural places were having fewer visitors, to the point that 80% of museums were empty. To make the matter even worse, due to COVID-19, all these places were forced to close, which meant that there were even fewer visitors. After the pandemic, the doors are opened again, and visitors are slowly coming back.
With this information, it was clear that we needed to understand which were the reasons for people not visiting museums and cultural places, and on the contrary, what made others visit them. We started brainstorming to decide what information we wanted to collect from users.
Surveys
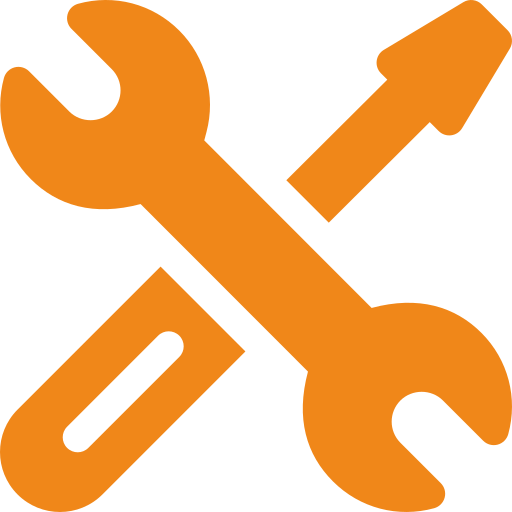
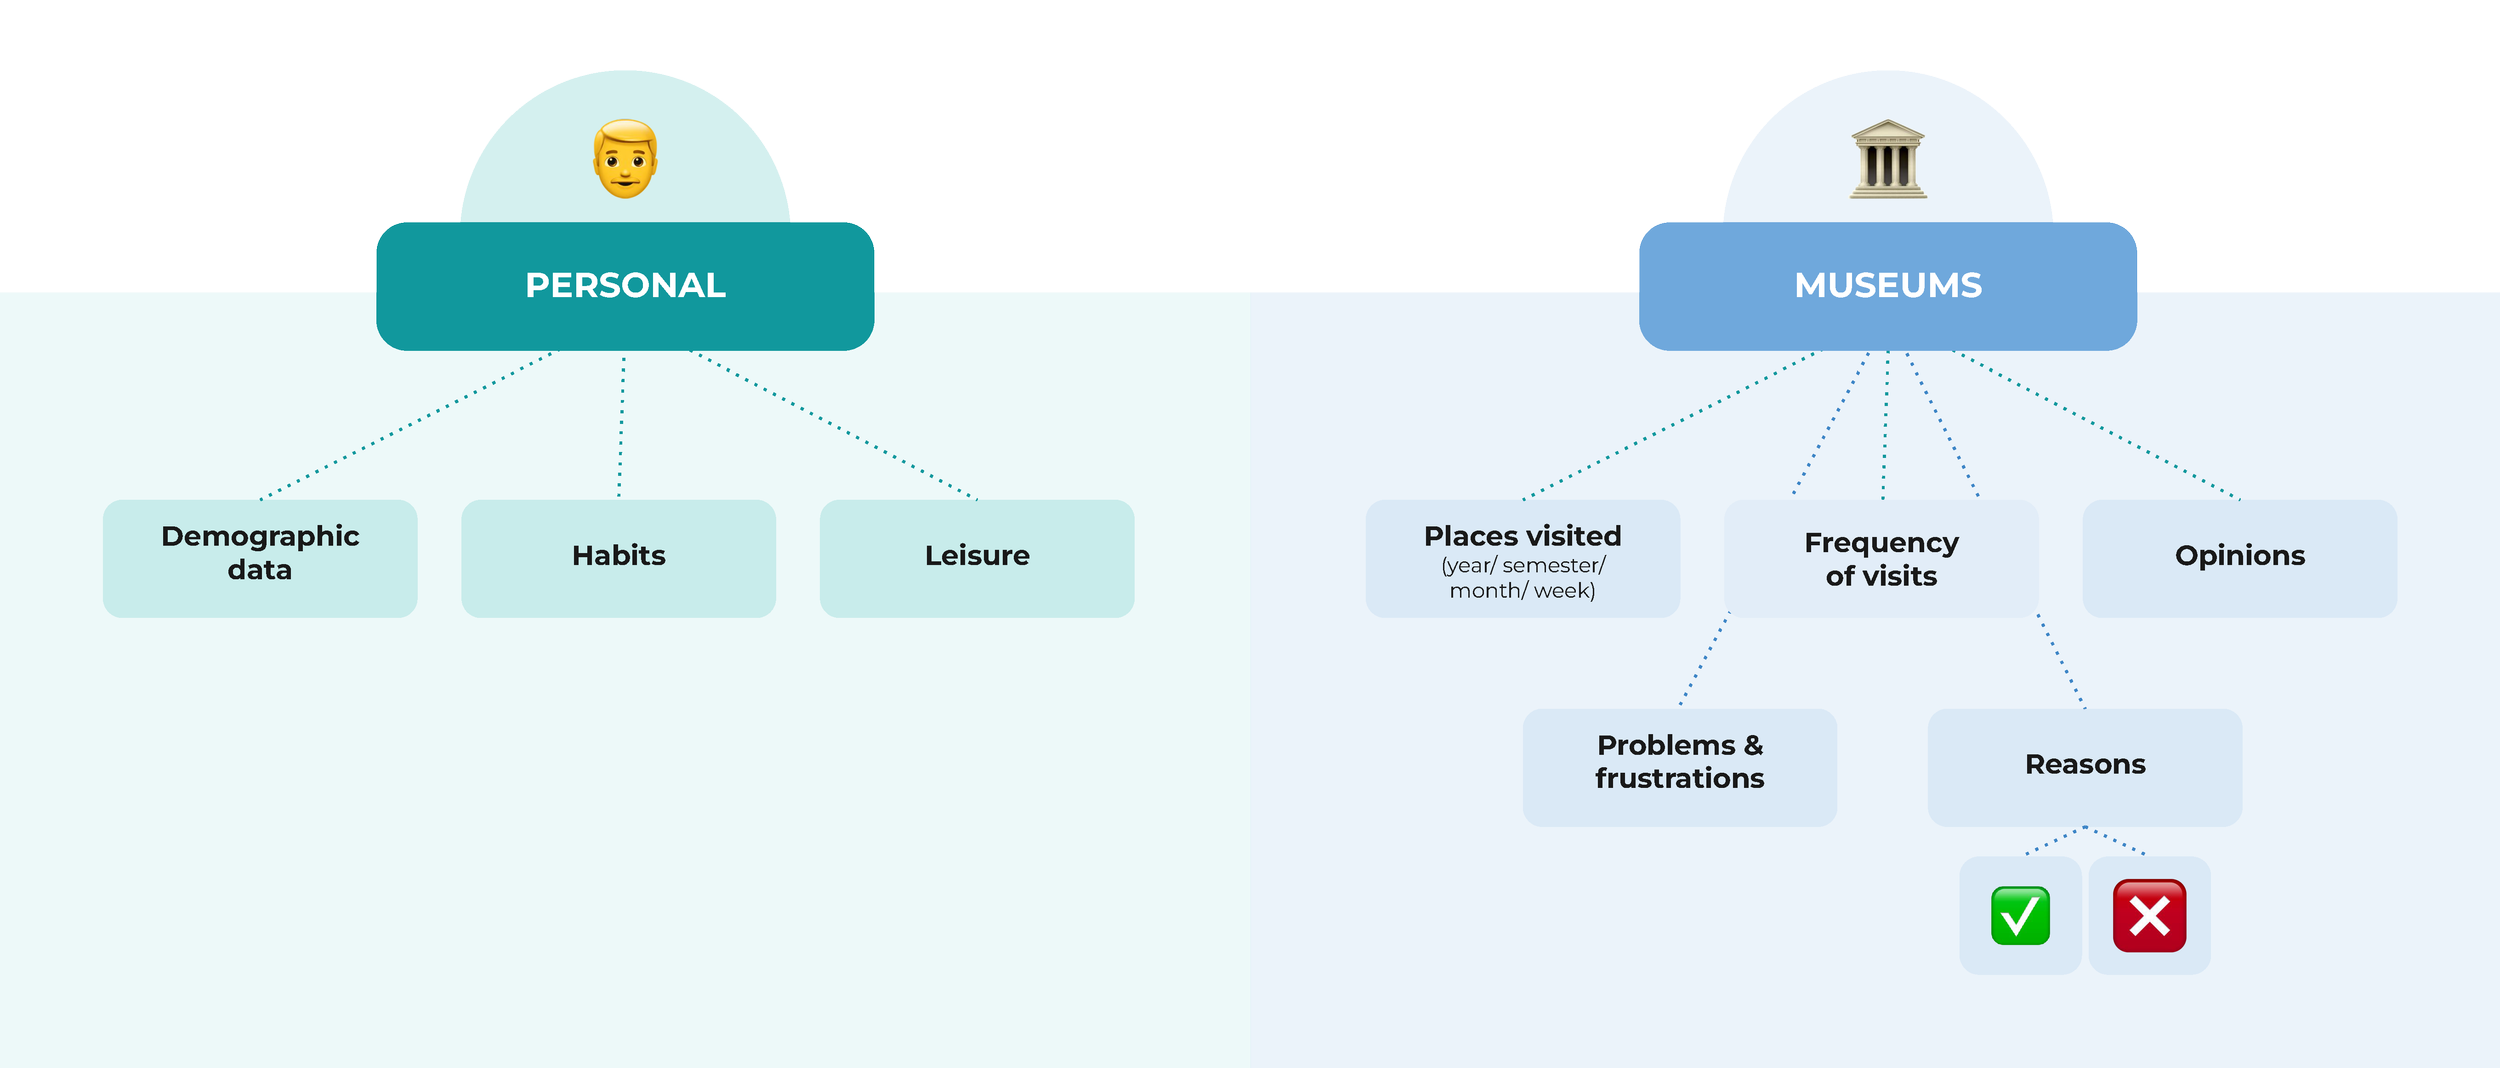
We started by running a survey to gather quantitative data from our users. Apart from demographic data, they were asked questions about their habits and leisure activities they usually do in their free time, how often they visit museums and cultural buildings, and reasons not to visit them. As a summary, the next data was collected:
User Interviews
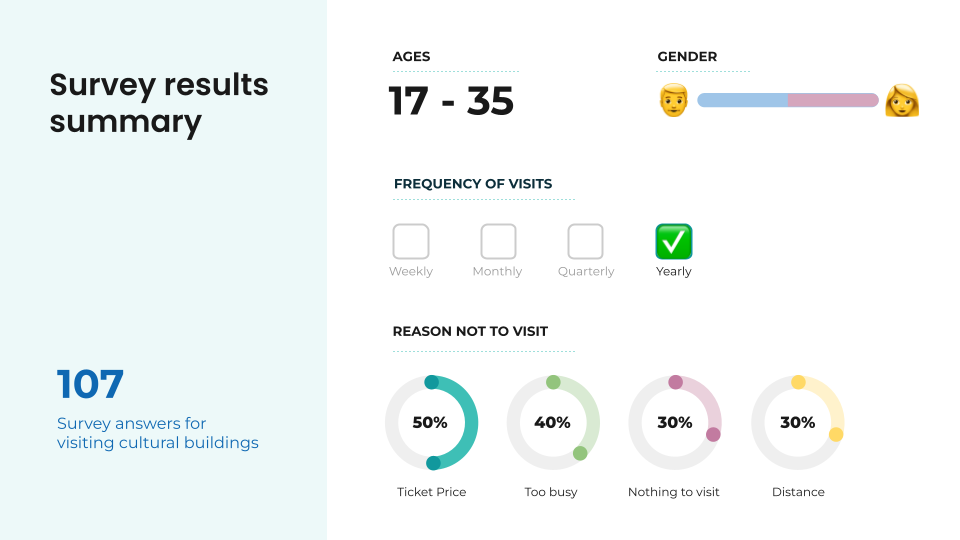
Once we understood which were the main issues users had with museums and cultural places, we wanted to learn even more about them and collect qualitative data by interviewing some of the users. Before running the interviews, we defined who were our main users and what we wanted to learn from them. Afterwards, we draft an interview guide for generating the questions. Once the interviews were held, we gathered very precious insights.
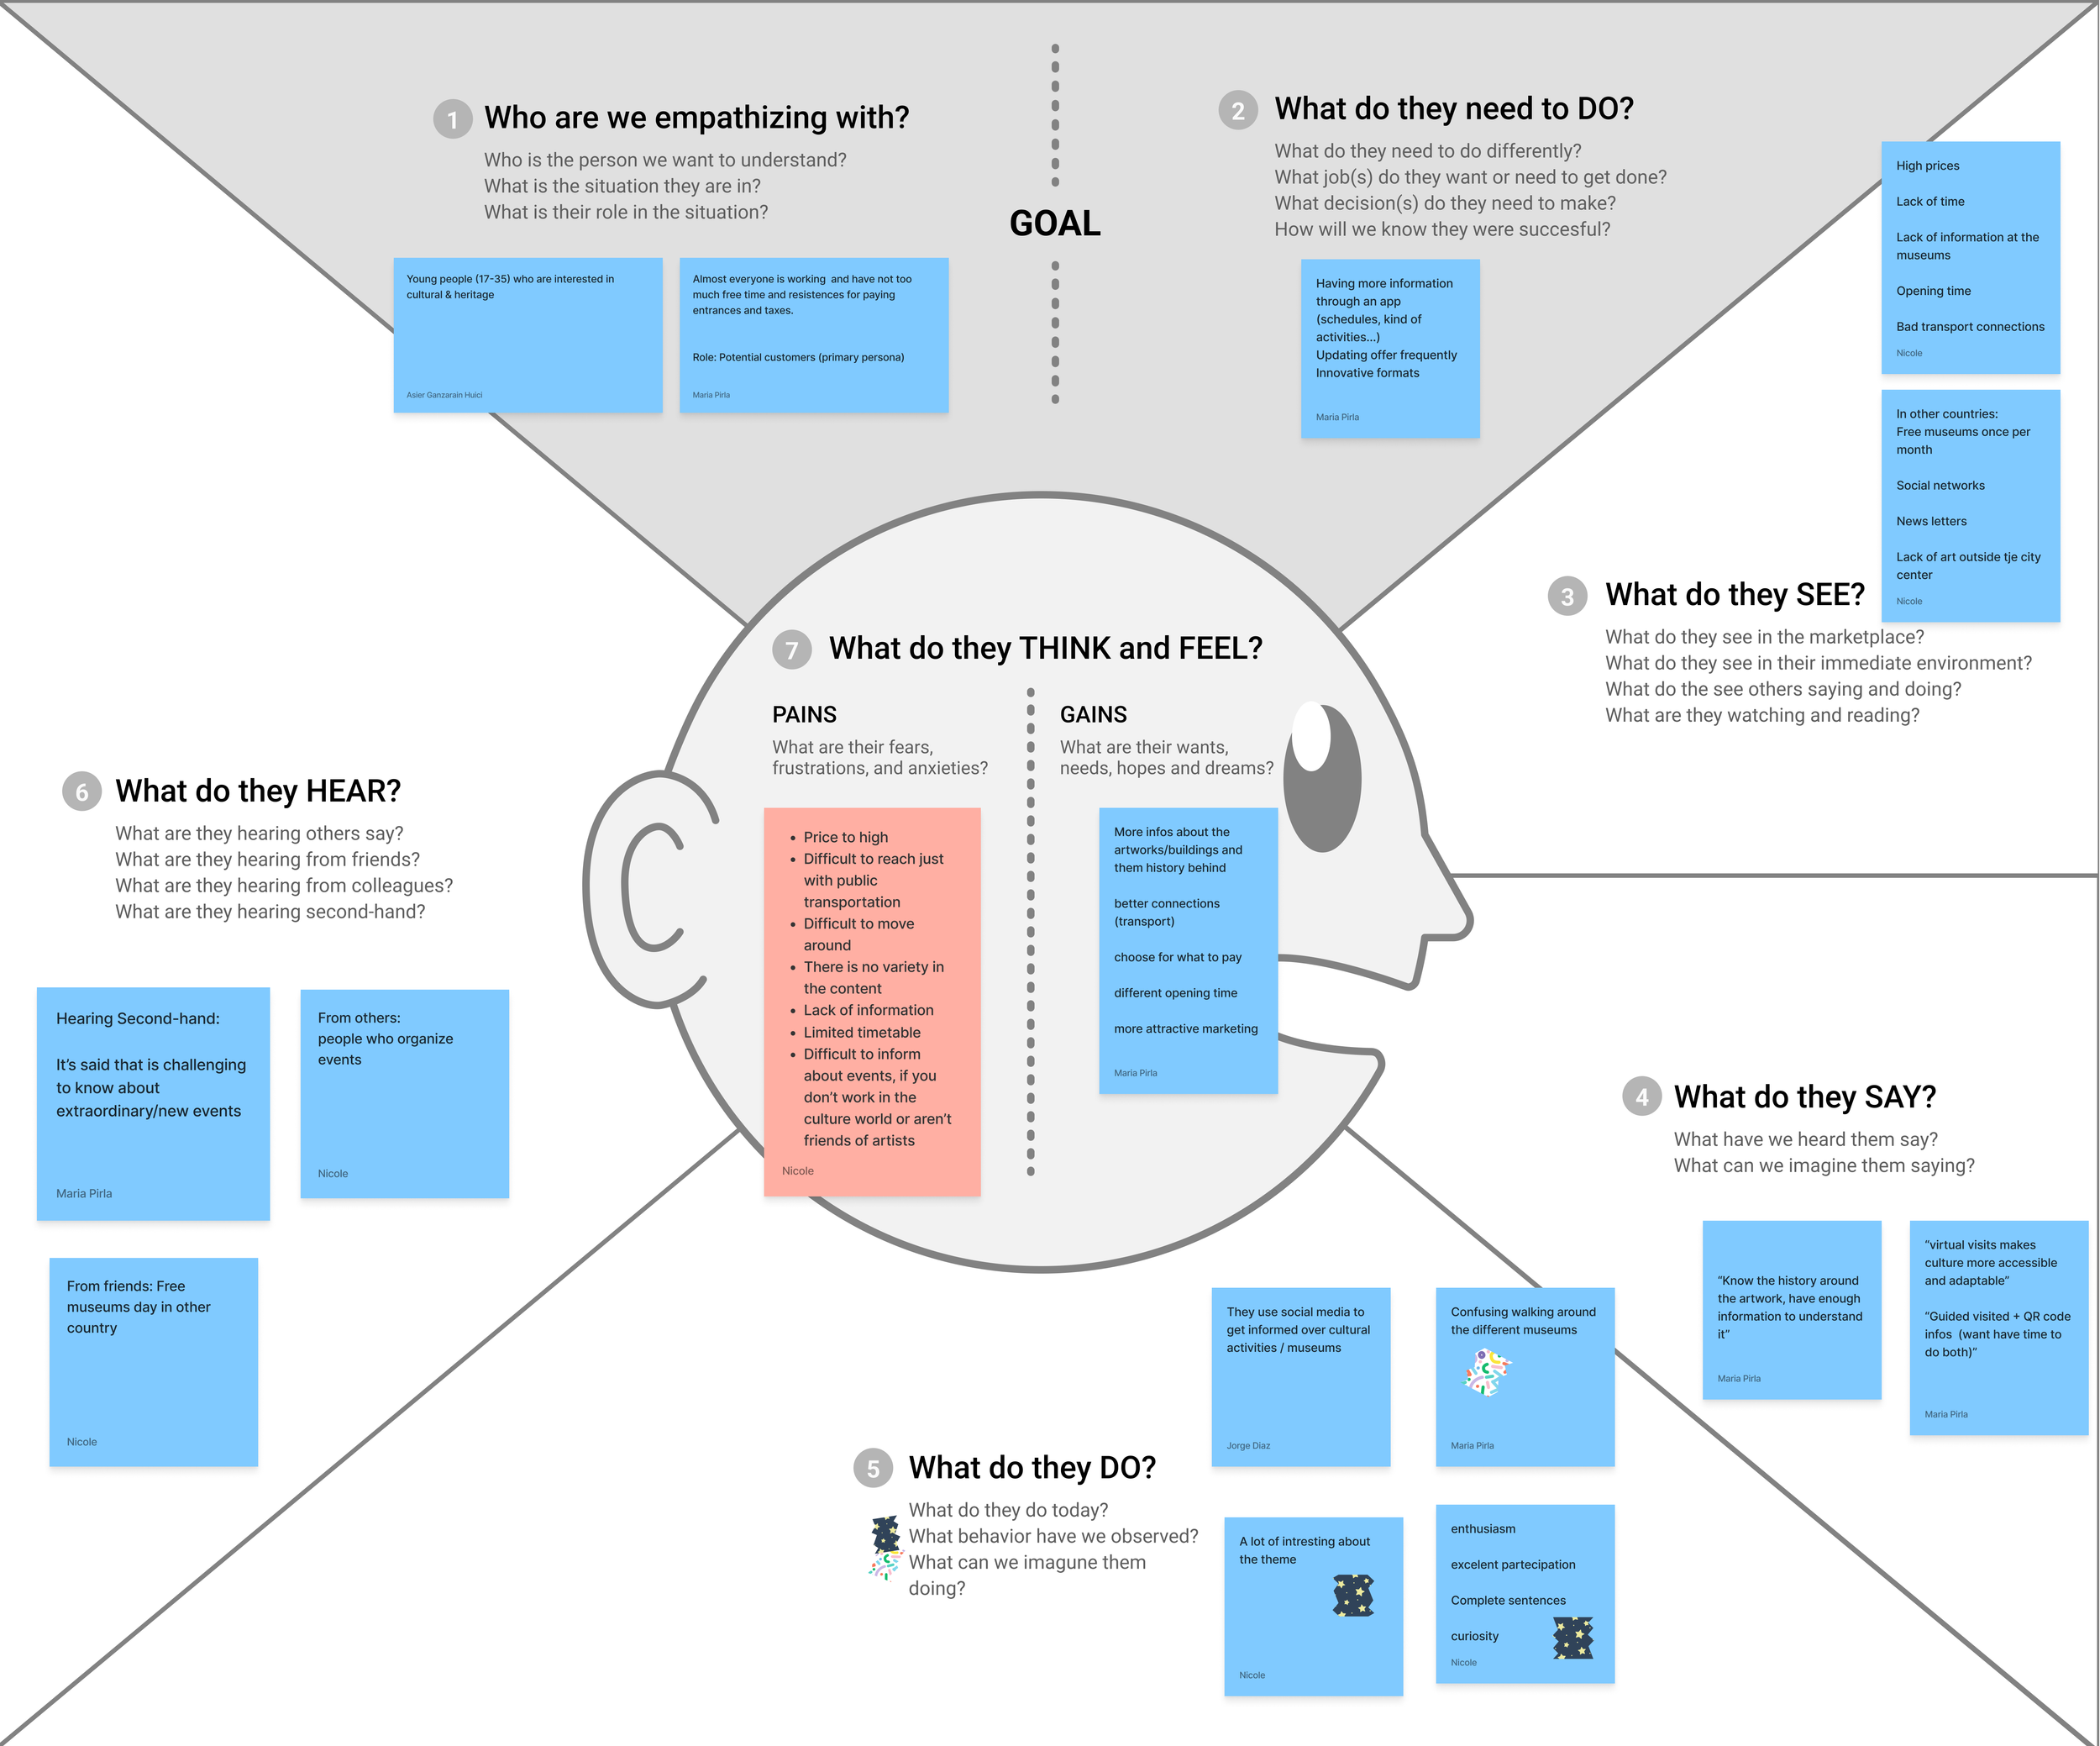
Affinity Diagram & Empathy Map
To understand what problems the users have, all the insights from the interviews were grouped and classified, forming an affinity diagram. The insights were grouped into: “going to the museum”, “inside the museum”, “I’m not going because…”, “wishes and suggestions”, “make my experience better” and “searching for information”. At the same time, the insights were classified between pains (red) and gains (green).

With all the insights grouped, we vote for the most important insight to focus on. Then these insights were placed in the empathy map, to understand better the user's goals, frustrations and thoughts.
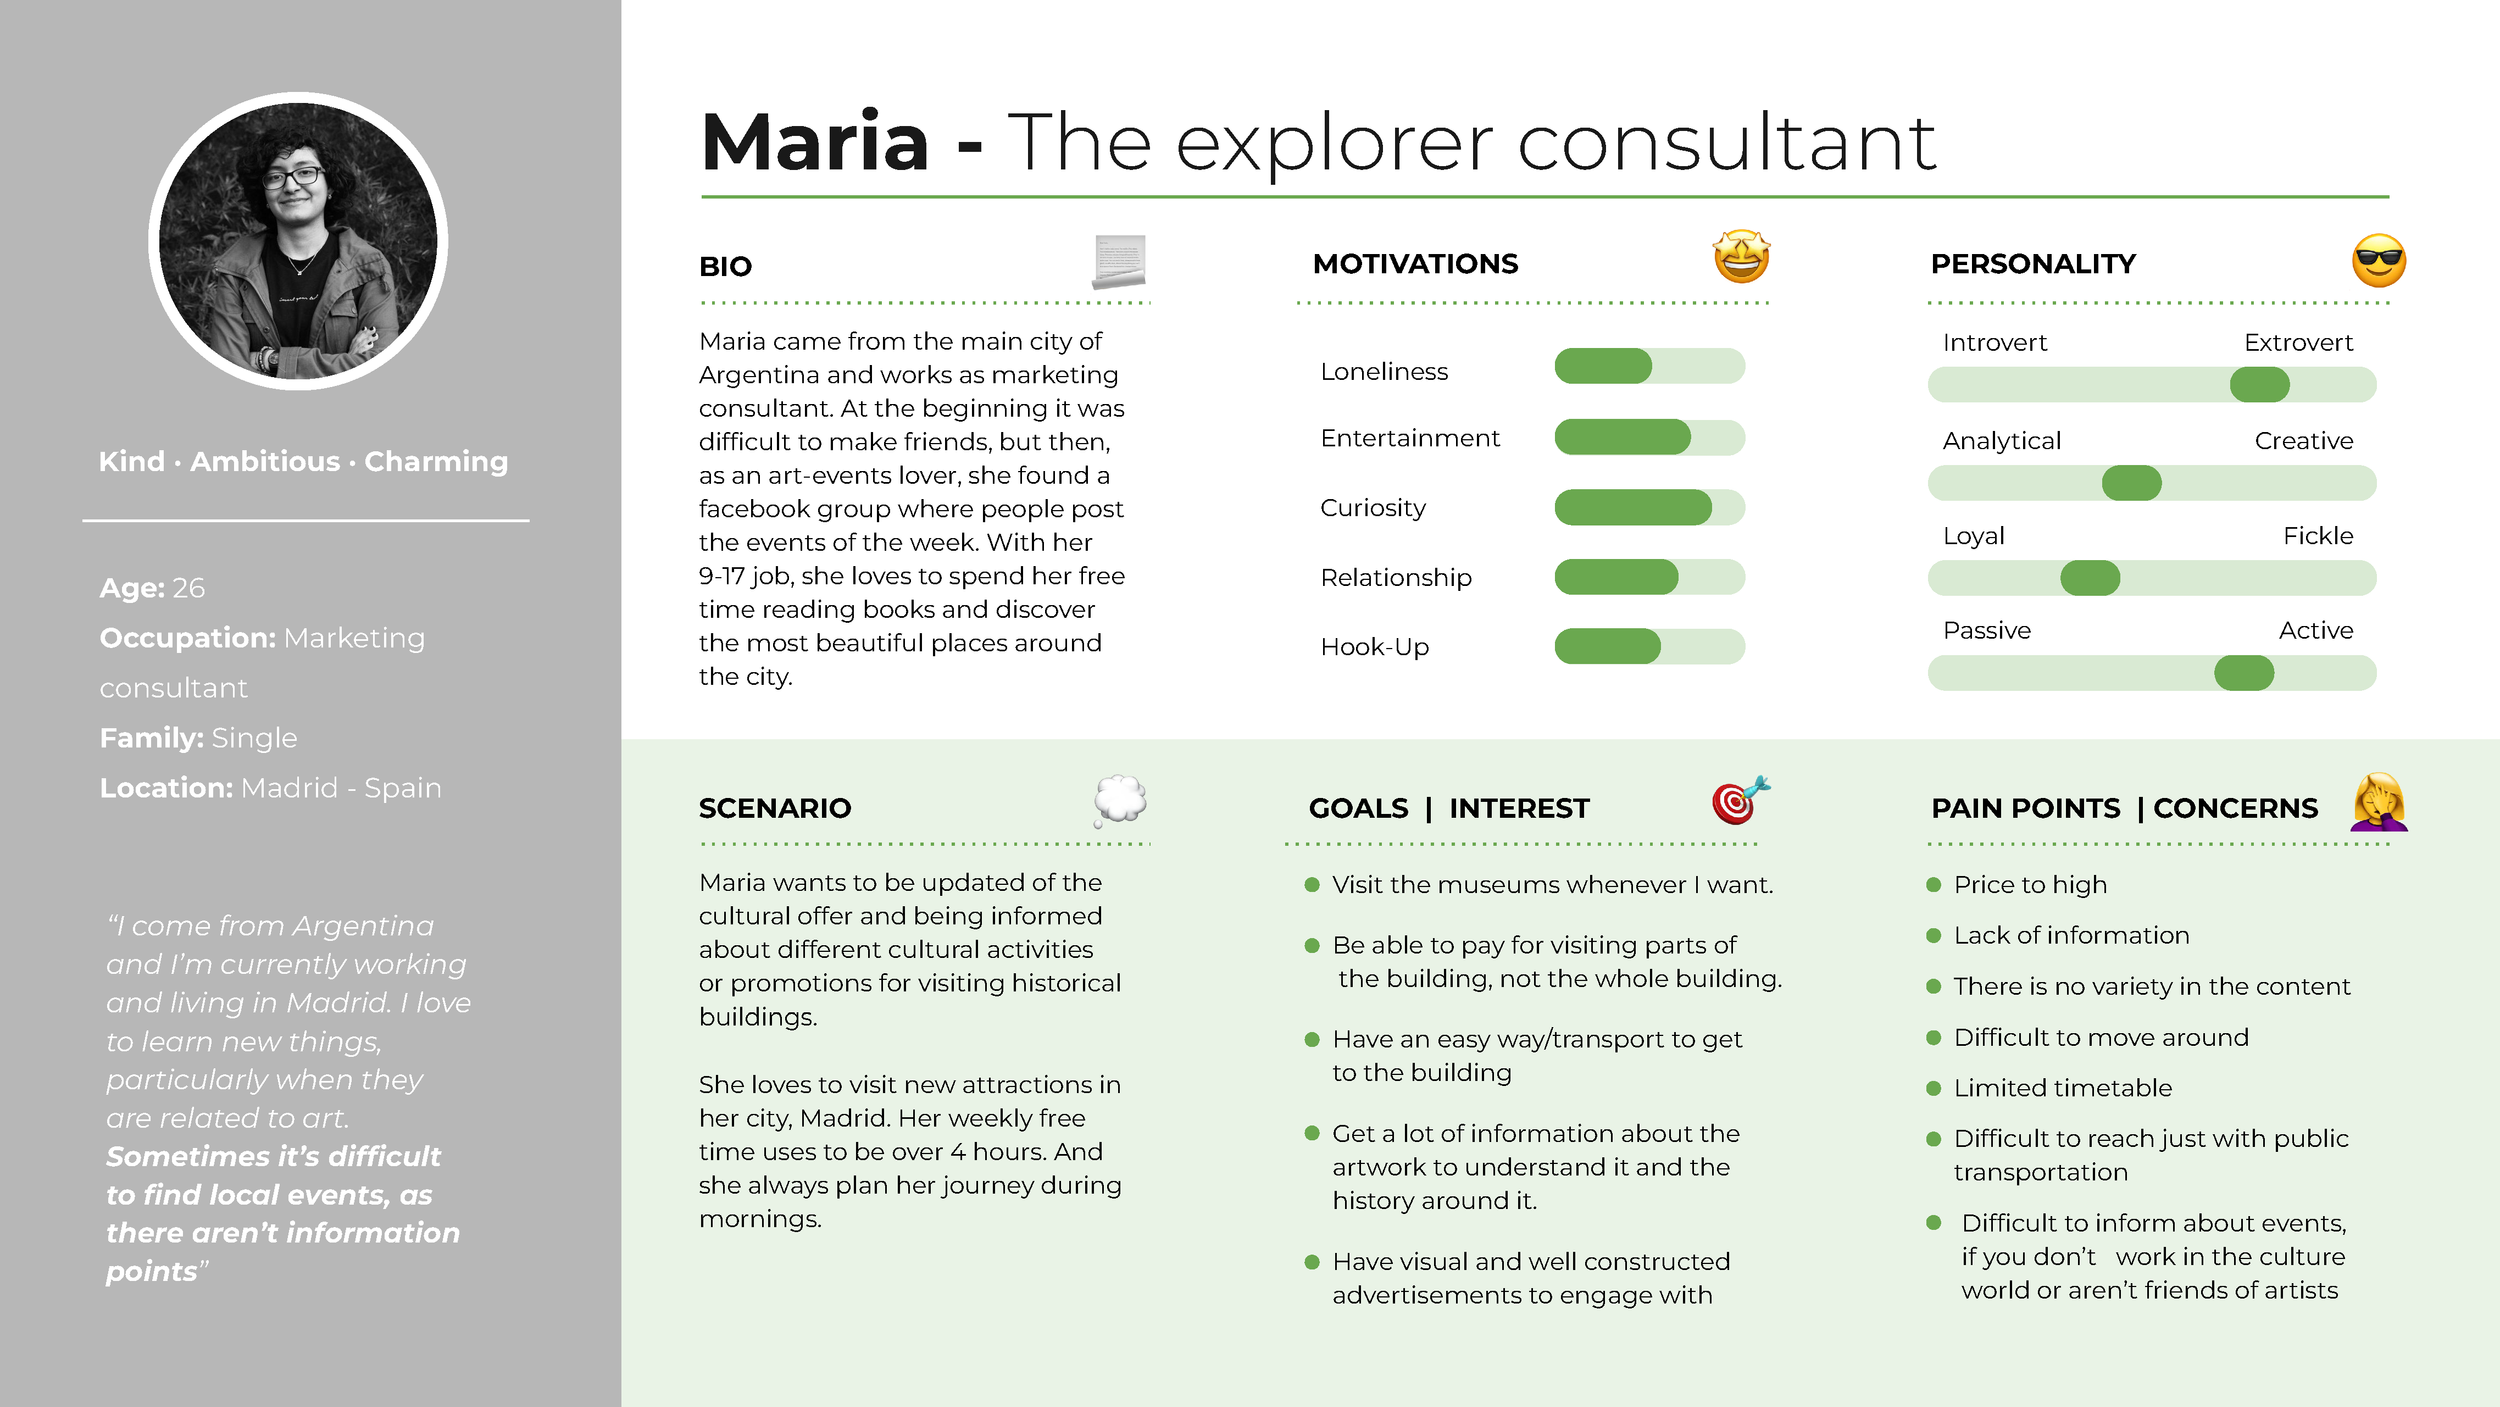
User Persona
After analysing the insights and empathising with the users, we were ready to create a user persona that could impersonate our main user group. Her name is Maria the explorer consultant. In summary, Maria wants to be updated and informed about different cultural events and exhibitions, but sometimes it's difficult to find information.
User Journey Map
With the user persona defined, we created a user journey map to see how Maria feels and acts during a day visiting a museum. The day goes from deciding to go to a cultural event and searching for information, until leaving the event. The main pain points she suffers from are the lack of information available, difficulties to reach the event and slow access to it with a lack of information from the staff.
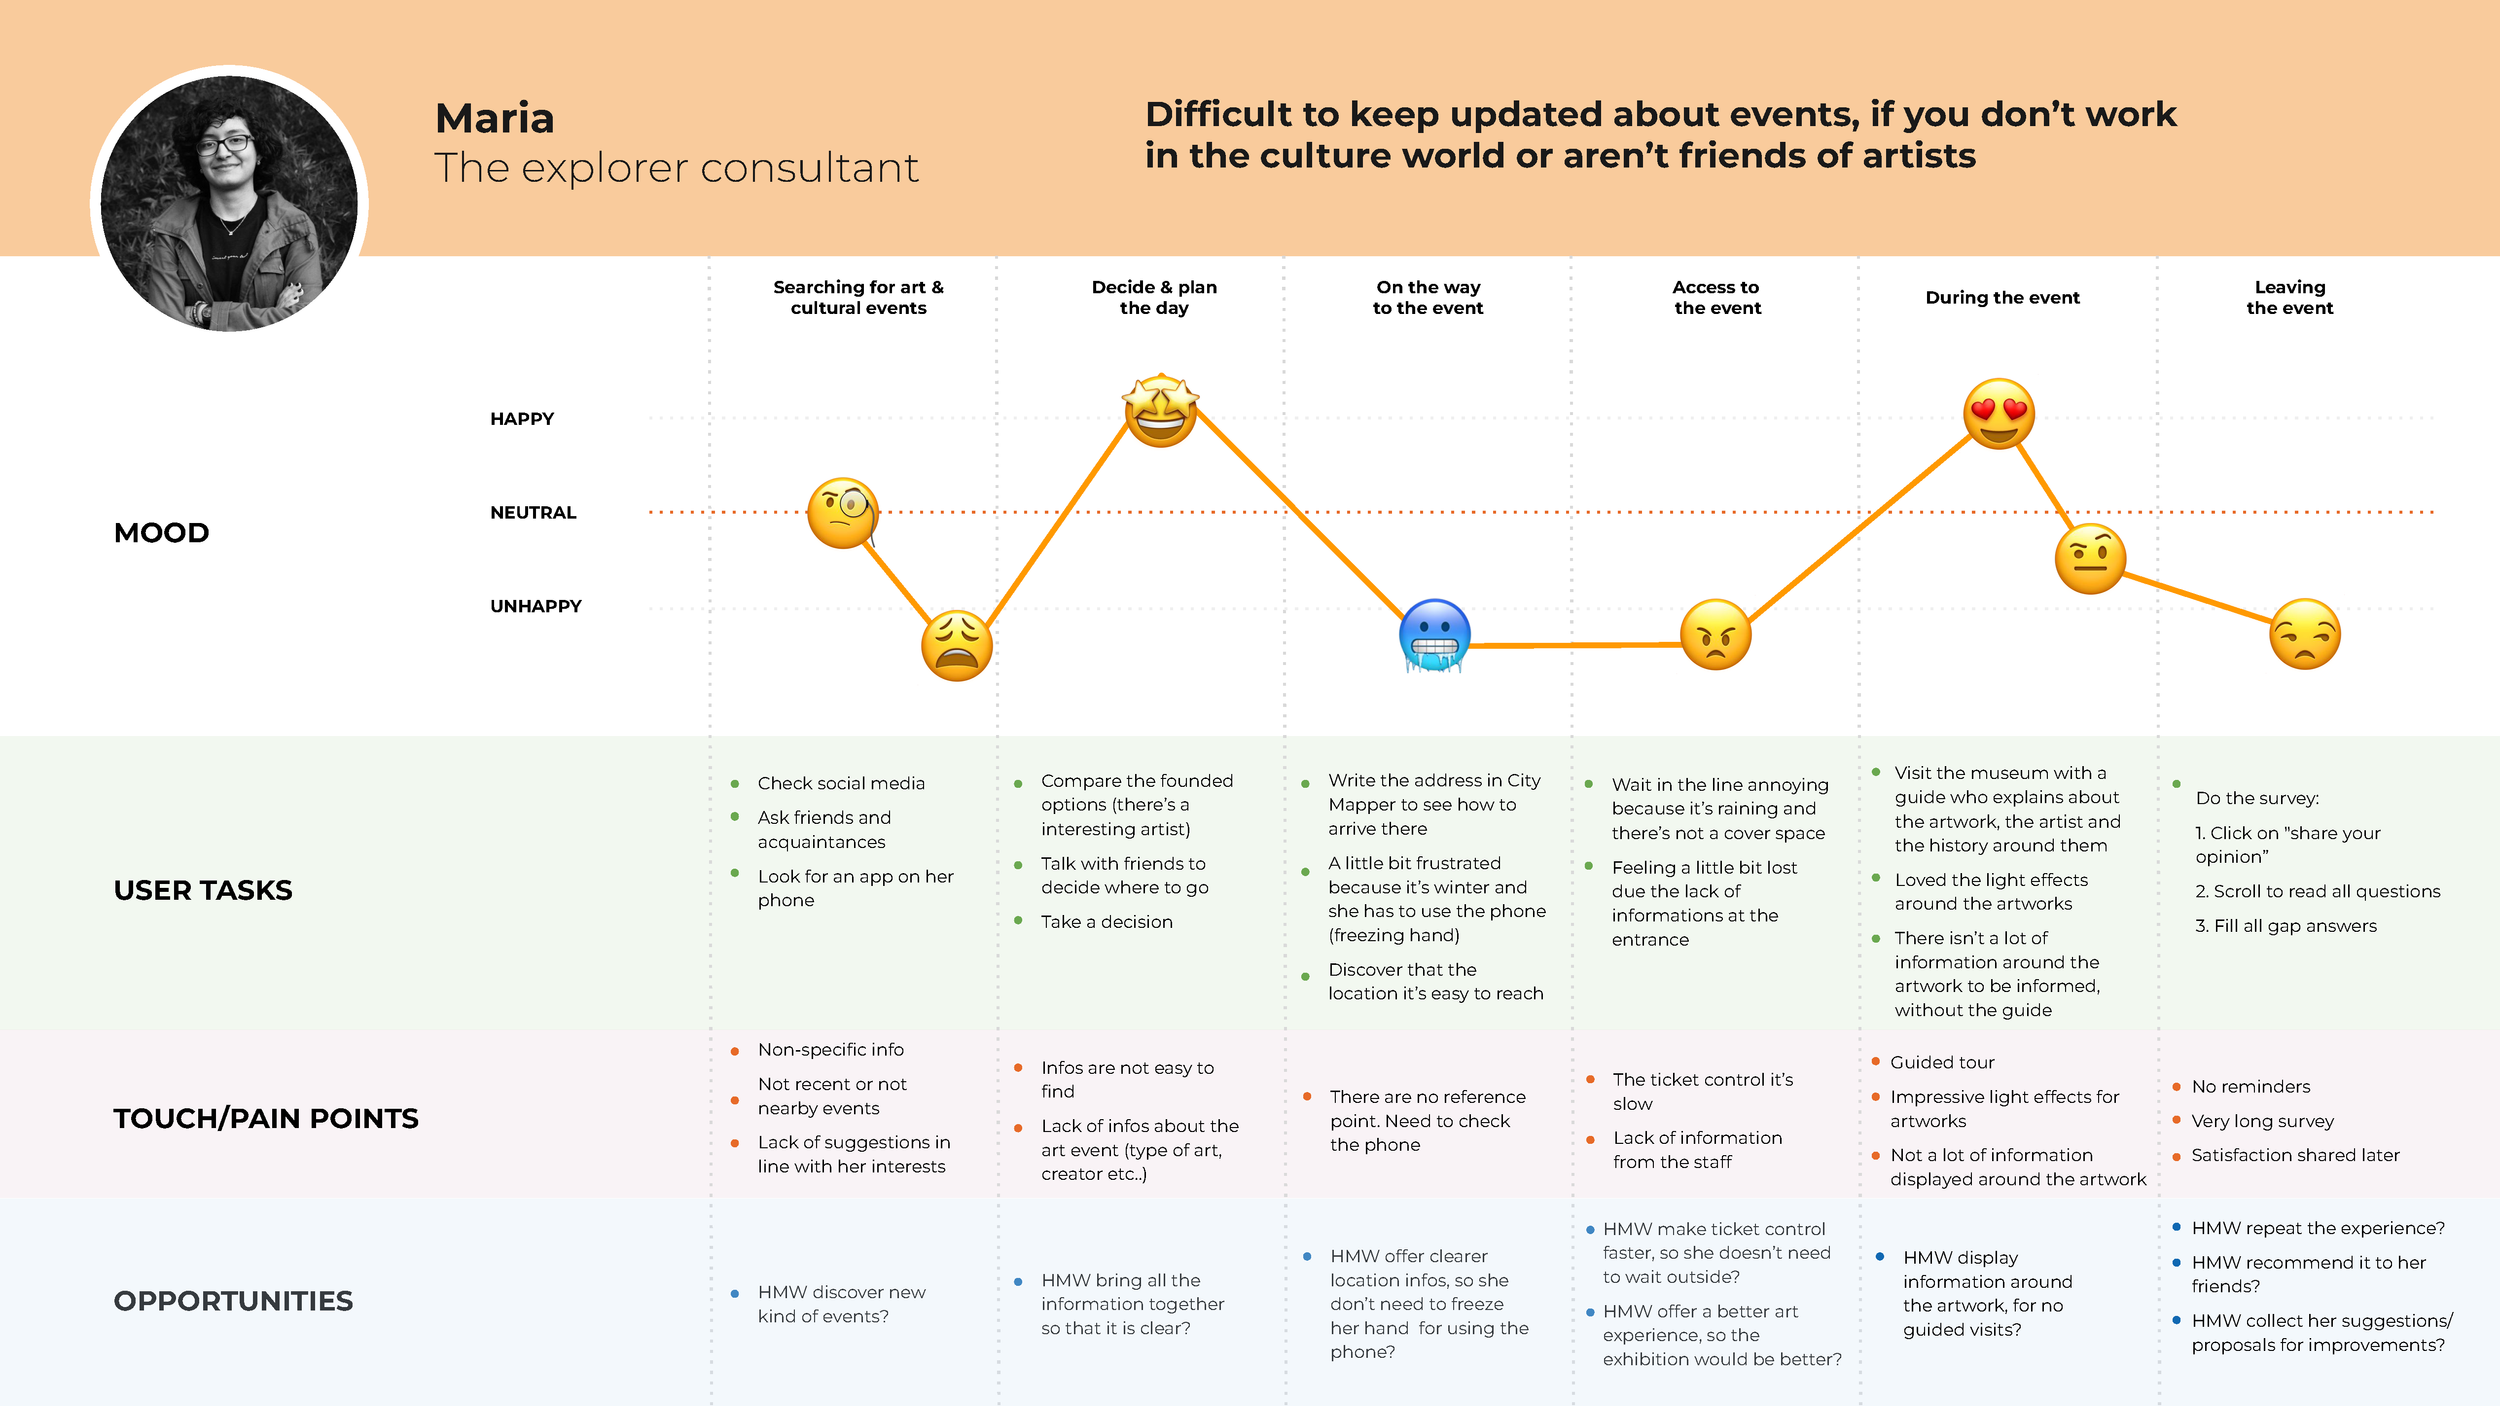
Maria wants to keep herself updated and find all the necessary information (organized and filtered, according to her preferences) about different cultural and heritage events, because she finds it hard to get all the relevant details in just one place.
Problem Statement
With all the insights and information gathered until this point, we decided to focus on the issue of searching for information about different events and exhibitions, by defining the problem statement.
To help find a solution to this problem statement, we defined 3 how might we statements:
How might we discover new kinds of events?
How might we bring all the information together so that it’s clear?
How might we improve the experience of visiting the cultural buildings?
Ideate
With the problem statement defined we were ready to think about different ideas to try to solve it. First, we brainstormed about how to approach the problem, and we decided to design a social media app dedicated to culture where users could share experiences, search for information and much more. Next, we need to think about the different features the app was going to have, so we brainstormed again.
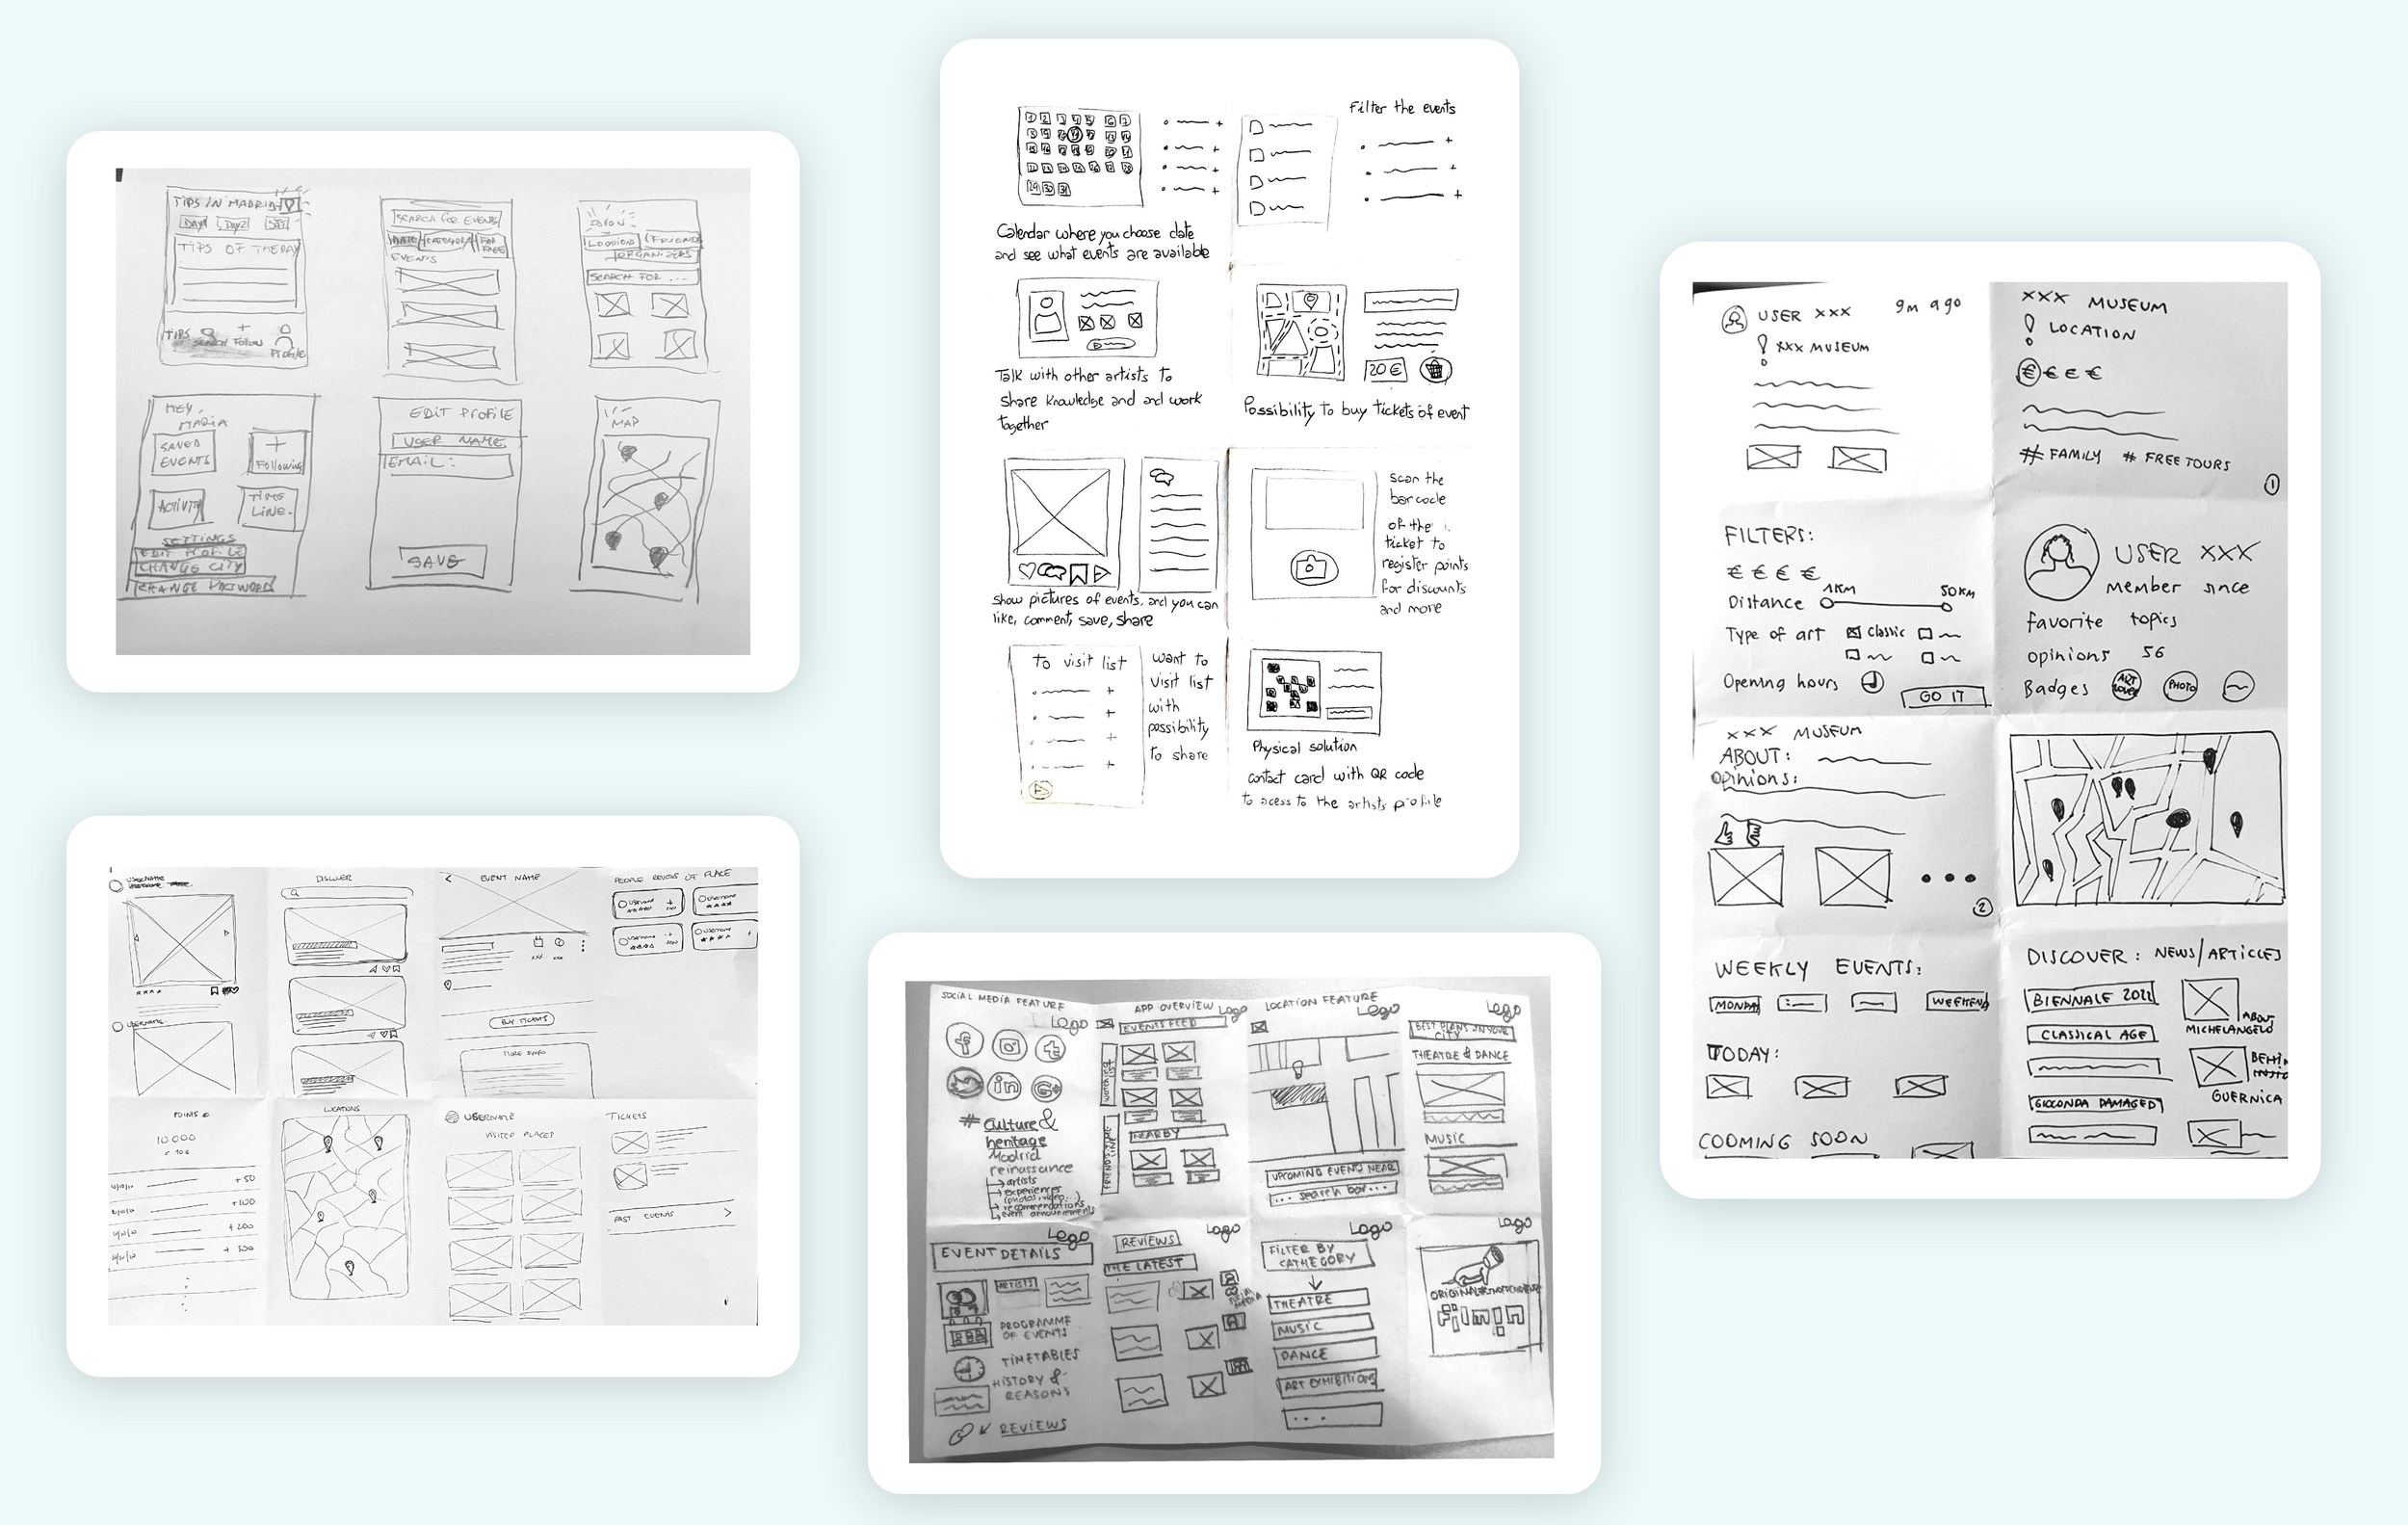
Concept Sketch
Once we decided what we wanted to have on the app, we run a crazy 8’s to sketch out how those features could be. This was very helpful because we realized that some ideas could be combined in the same feature, so we were able to define how each feature was going to be.
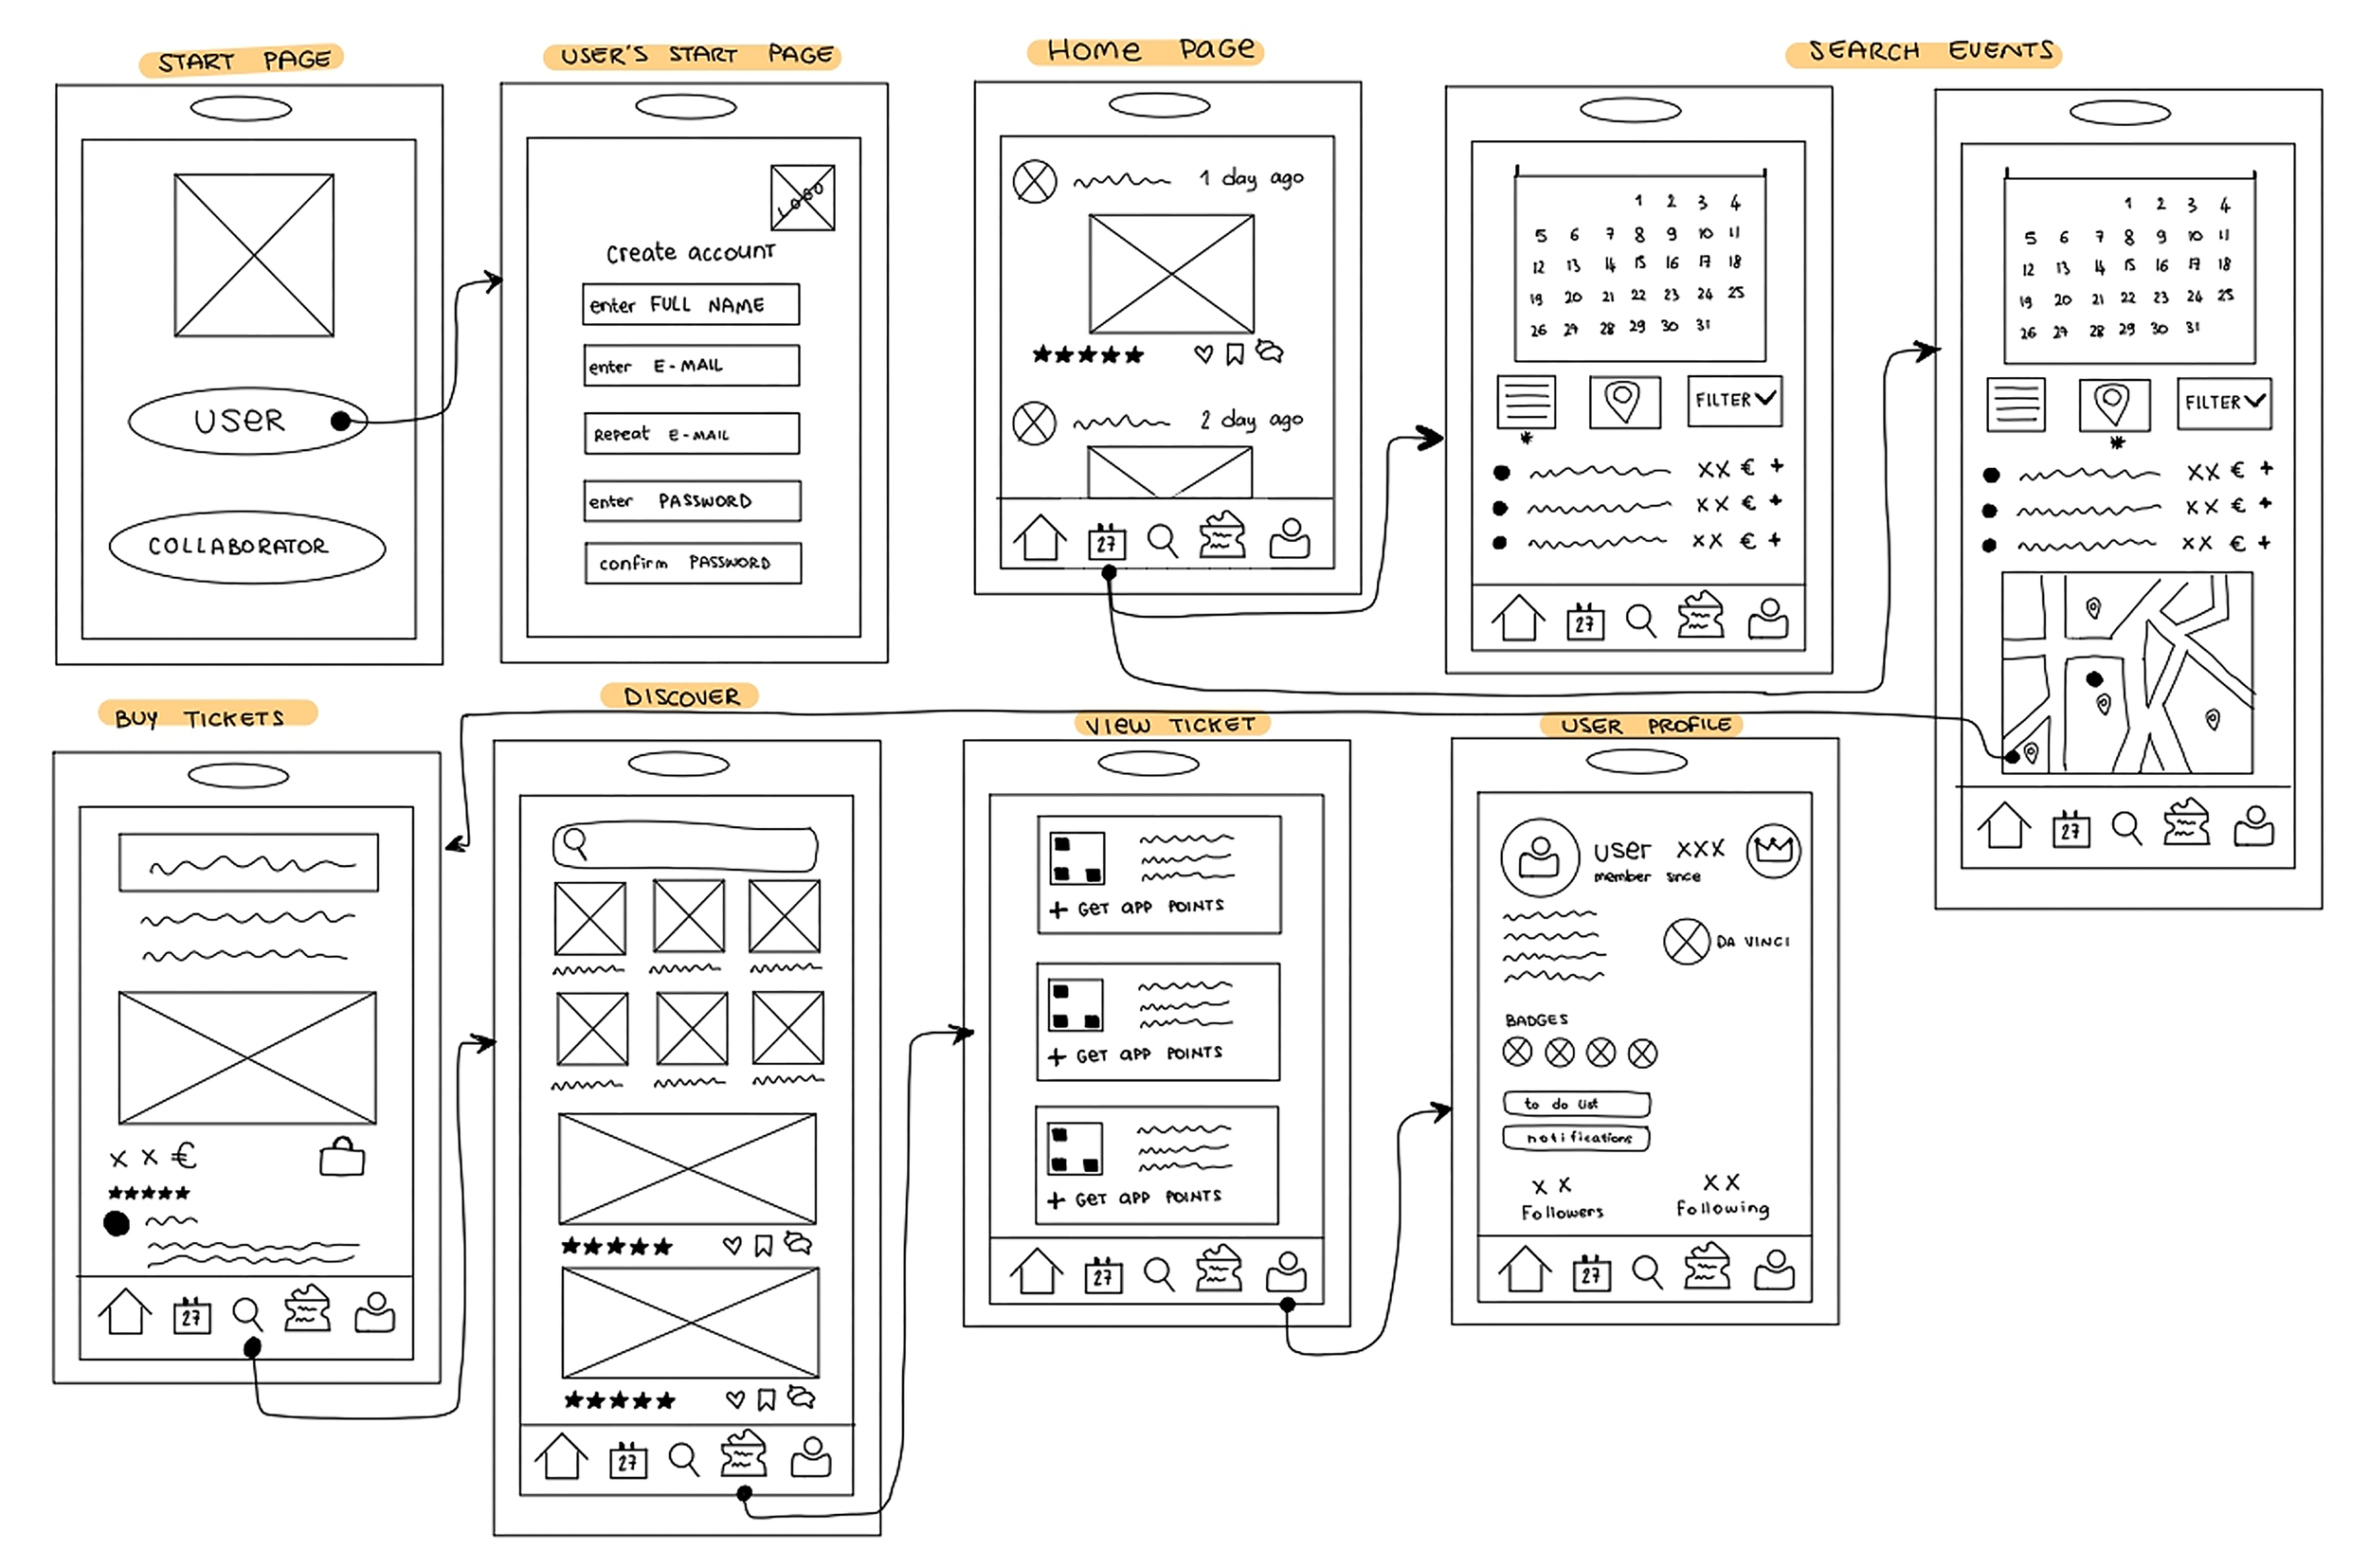
Low-Fidelity prototype
With the different features defined, we draft a first low-fidelity prototype to show the user flow. With this social media, users can search for different events and exhibitions, see comments of other users, rate them, purchase tickets and have them all together, and see other users' profiles to interact with them.
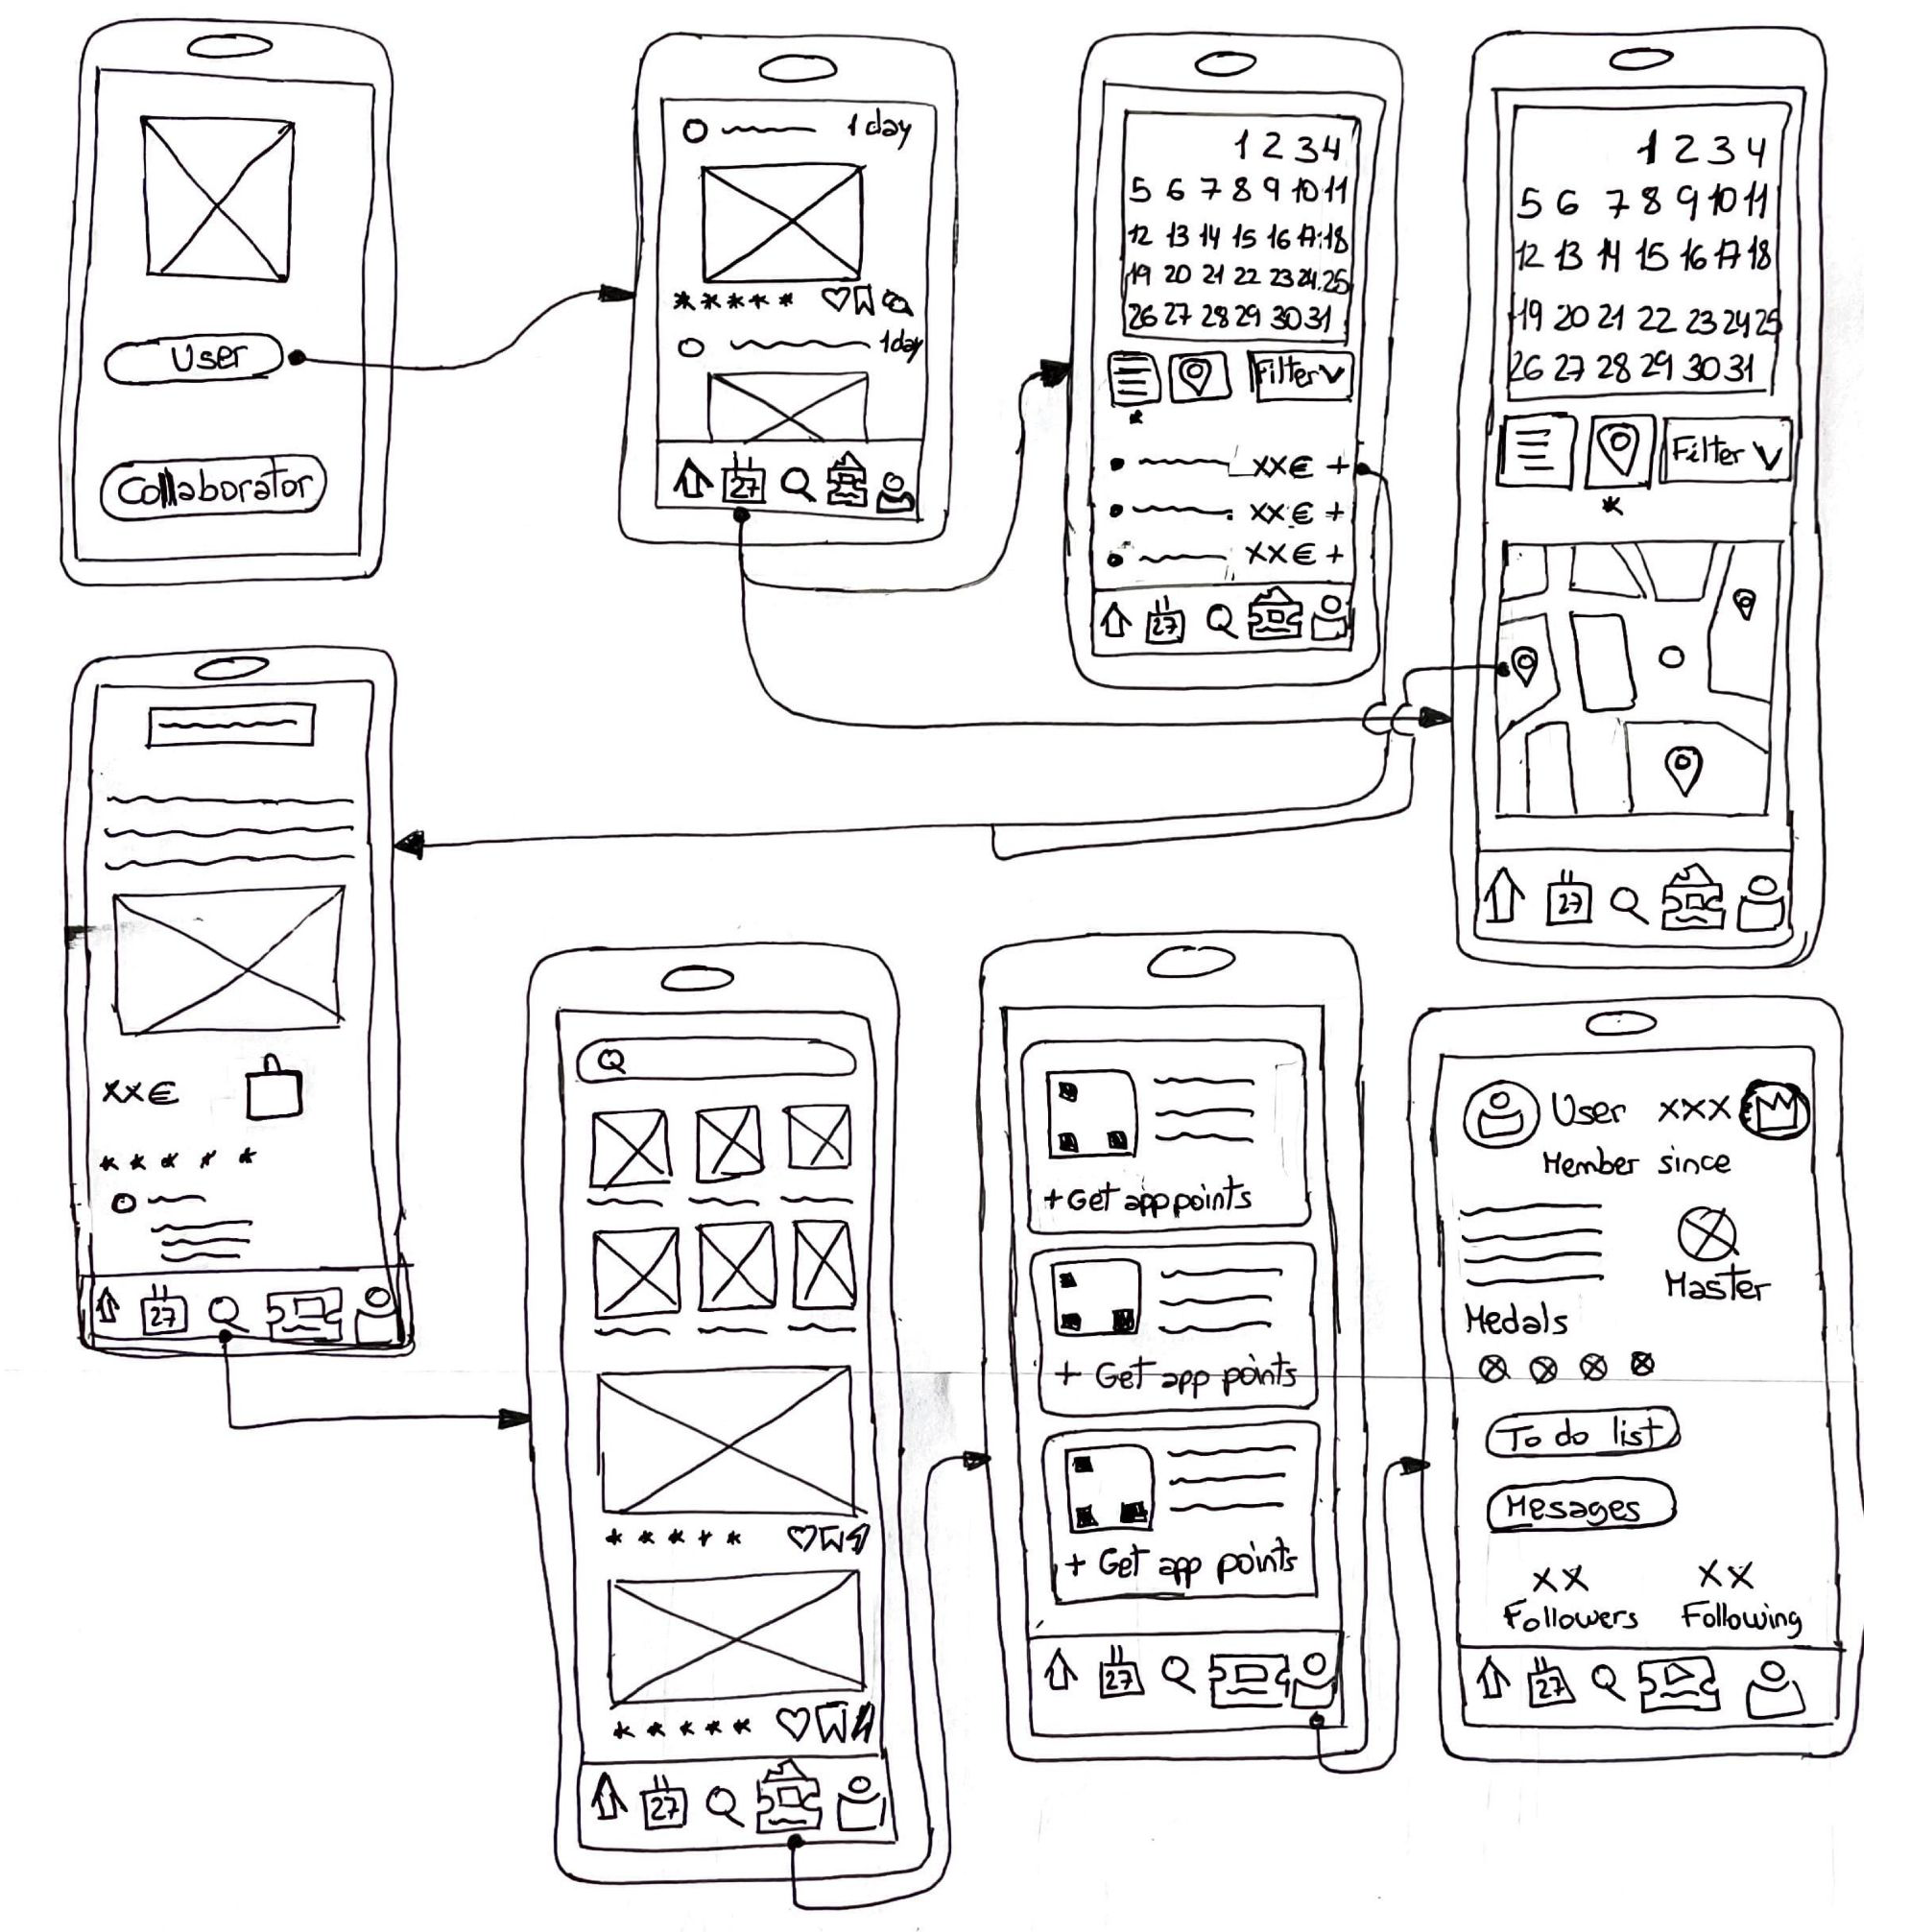
Next, we polished the low-fidelity prototype by adding some features that were missing.
Next steps
Next, we should run a usability test to see how users interact with the low-fidelity prototype and gather feedback to improve the design and define a mid-fidelity prototype. Also, the collaborator’s user flow could be defined for cultural places to be able to collaborate with the social media by adding their events and exhibitions.
Conclusions
With this project, we have learned how to apply all the phases of the Design Thinking method to offer a user-centred solution. It was very interesting to interview the users and get to know their goals, frustrations and pain points. Then it was very intuitive to create a user persona and the under journey as both reflected what the users said, did and feel. Lastly, we also learnt a lot from making our very first low-fidelity prototype and thinking about how the different features would be and the interaction between them. It has been a very interesting project to work on by putting all these UX principles into practice.